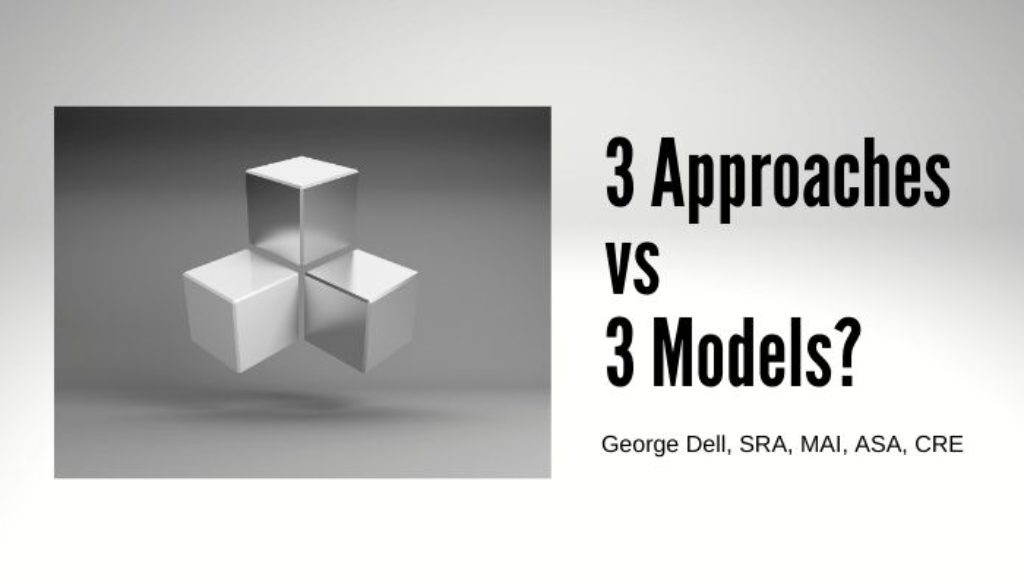
Three approaches to value evolved from the scarce data of the last century. With abundant data, three predictive models have evolved.
What is the difference? Approaches vs models.
The difference is like looking at a cube from the side or from the top. The top gives one view. The side shows another. In fact, they look at different things.
The traditional ‘three approaches’ compare subject features to pre-selected comparable features. Although subjective, it is easy to understand and provides a clear goal of a handful of ‘comps’. The human brain easily holds up to four or five pieces of information. Beyond six or seven, it zonks out.
The cost approach was particularly useful early in the 20th century, when land values were quite low relative to the cost of the improvement, the house. Land values from 10% to 30% of overall value was common. Today, in many areas of the country, land values easily exceed 50% or 60% of overall value.
The income approach was also relatively easy in those days for many income properties. A GIM (Gross Income Multiplier) or capitalization rate matched the thinking of agents and investors. Today, complex leases, rent controls, environmental issues, and government planning mess with simple multipliers.
The direct comparison approach was always easy and works well wherever you can ‘find’ three or more good ‘comps.’ A comparable is defined as similar, competitive, and able to be compared. The explanation is circular, but ‘everyone’ understands it – or do they?
The side view of the cube is different today. Instead of comparing comps, we measure markets. Simple, but a huge difference in results and deliverables! Easy to dismiss, but obvious once the mind admits the possibility.
This side view is in fact visual as well as simple in numerical analysis. The view from this side of the cube means we can see the whole market instead of three pre-selected comps.
The human brain can and does easily ‘see’ the market. It can understand from a graph, an index, or summary number. It can compare, relate, and estimate results. Instead of the subject determining a handful of easy comps, it is the market that determines the subject position.
The three basic algorithms relate to three major models: contrasting; association, and sequencing:
- Contrasting is like the old ‘grouped-pair comparison,” but models systematic data control.
- Association comprises data control, visual plots, and simple regression.
- Sequencing is ‘qualitative’ in nature but applies modern tools (such as non-parametric methods).
The “Three Approaches to Value” were excellent for their day, and still are required for poor-data, sparse-data situations.
In the Valuemetrics.info classes, such as Stats, Graphs, and Data Science1 we focus on new methods, new opportunities, and better service to the public good.

December 16, 2020 @ 11:46 am
George, with the availability of data spread sheets on current MLS systems, the appraiser can offer both. The appraiser can include market trends/spread sheets that show the price per square feet, price per bedroom, median price, average price, change in prices over the last 30 days, last 12 months, the sales price vs list price ratios, days on market, months of inventory and absorption rates based on closed, active, pending sales. The average and median sales price trends over the last 2+ years, etc.. My software provider offers regression analysis as part of the tools which can easily be manipulated. Now we can also run the same spread sheets on land sales and listings. How much data do you want?
March 11, 2021 @ 8:56 am
I agree!
In sparse data situations, the traditional thinking is appropriate. What IS important is the sharpened judgment which comes from the data science approach — as well as competence in knowing which model to use when.
George