More graphs: in data science, why are they so important?
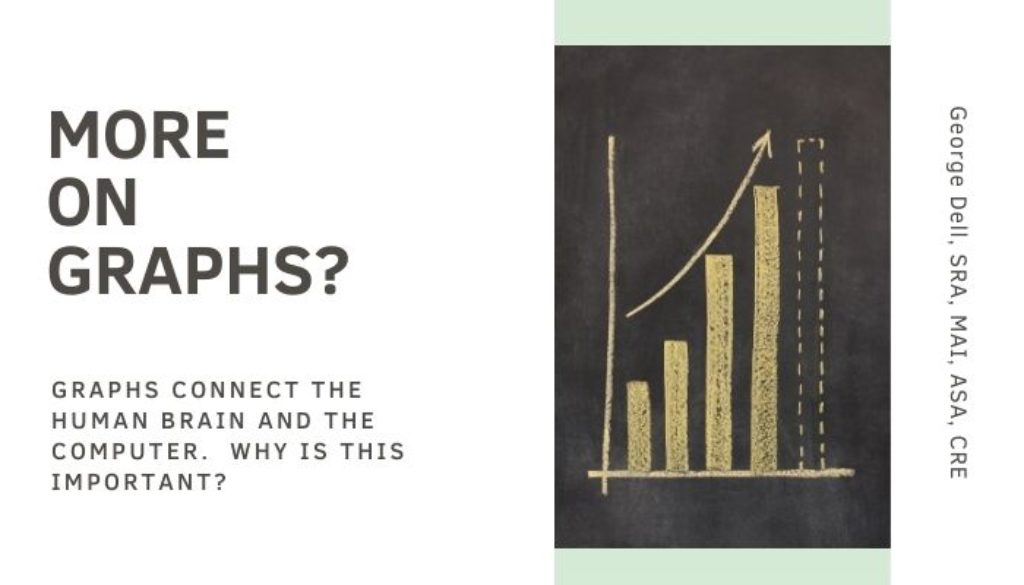
Graphs provide the way for the human brain and the computer to connect. And why is that important? More
Computers are really good at certain things. They can handle lots of data and can quickly carry out complex instructions (algorithms) with no mistakes, with perfect memory. They also work well with no sleep. These are things the human brain does not do well.
Humans are good at other things. We make decisions and solve problems based on “massively parallel processing” systems. These are our ‘common sense’, instincts, and broad knowledge of the topic at hand. These can be called imagination, creativity, and even belief-based inspiration.
“Computers can outperform humans on certain specialized tasks, such as playing [the game] go or chess, but no computer program today can match human general intelligence,” says Murray Shanahan, Professor of Cognitive Robotics for the Department of Computing at Imperial College in London. “Humans learn to achieve many different types of goals in a huge variety of environments. We don’t yet know how to endow computers with the kind of common sense understanding of the everyday world that underpins human general intelligence, although I’m sure we will succeed in doing this one day.”
Historically, in valuation, humans excelled at scraping together a few sales of similar properties. Then applying intuitive reasoning and prior experience to fudge (adjust) those comparable sales. Then on to present those three to six ‘competitive’ sales as illustrations in a report. A bit of wordy narrative explanation and justification — for thinking and reasoning intends to ‘support’ the opinion. Graphs were never used because it is silly to graph three sales. No help for the reader to understand anything about the logic or the data.
Later, as data became quickly available (on paper, microfiche, MLS books, and even over the phone), it became possible to pick comps, mentally identify a market area, and graph with dots and bars. Later, even impressive colors made paper reports attractive and draw oohs and ahhs.
Today, we can do the market identification and portrayal with visuals – graphs. These serve multiple purposes. They help us understand our first thoughts on the problem we face. They help us identify the actual Competitive Market Segment (CMS©), and place it in the neighborhood, city, or district spread. They help us with data selection, as well as prediction from that information.
The computer helps the brain see and understand markets, rather than comparables!
In turn, the expert brain is trained to see and compare graphs and market visuals. It hears the data, the market — sing to us. This training is intuitive and even inspired. It detects and evaluates outliers instantly and makes relevant decisions on the fly.
The brain feeds the computer. The brain manages the computer. The computer enhances appraiser knowledge, experience, and training. The perfect blend of art and science.
Valuemetrics.info is dedicated to optimizing the brain-machine team. This is the “hybrid” of the future.
Stats, Graphs, and Data Science classes train appraisers to be asset analysts! Asset Analysts© provide more than just an opinion. More than just a point value. Much more.
