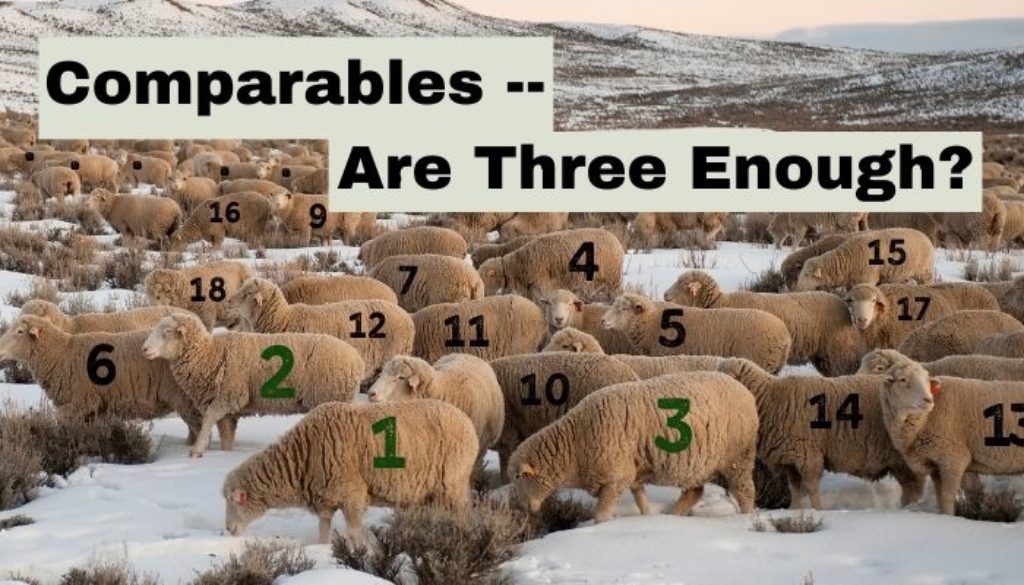
Three comparables have been the standard for many years. On the residential appraisal side, some clients ask for more (such as current listings). For ‘general’ appraisal, typically four to six comparable sales are enough to achieve believability (credibility).
Believability arrives at the user’s desk in a readable report. In the past, the standard residential form has provided space for a table of three comparables and the subject property details. The use of more than three required adding another sheet of paper. With the coming of electronic magic and printer machines, it became easier to provide more.
Commercial appraisal also used a few comparable ‘data sheets”, summarized in narrative. The coming of the accountant’s spreadsheet – in electronic form – made the use of more than a few sales easier. Around the same time, income property sales data became available in many areas in colored printed sheets (each color for each property type!).
Also, data started to become available over the internet, so long as you had a fast 60bps modem. But analytic software still was not really available, or quite expensive for both the hardware and programs. There was no real motive to use more than the minimum data.
Then came software, hardware, high resolution screens, and instant internet data. Still, everyone still stuck to a handful of comps. Why?
Usefulness of an appraisal opinion depends on three factors: good data, good logic (algorithm), and understandability. The goal should be the best data, the best algorithms, and human understandability.
Today, we have data, instantly available, of far better quality than say 40 years ago. We have good logic, augmented by computer algorithms. So the question we ask may be answered by the need for human (appraisal user) understanding.
The human brain is amazingly good at certain things. In particular, the ability to generalize and visualize. It is easy for us to see three or four sets of data, and mentally compare, contrast, and associate, and generalize to a conclusion – even with complex multi-dimensional data.
We can ‘see’ four or five data pictures side-by-side, and make sense. We seem to lose this ability right around six or seven data points. More than that we cannot ‘see.’ We find it difficult to generalize. We must apply rates, ratios, and summary numbers. We easily accept a capitalization rate or income multiplier, taken from the ‘market.’ We apply the rate/ratio to subject financials, and viola, the answer.
Even though we provide an analytic result, we do not call it that – lest we be accused of poor logic or inadequate analysis – and get sued! What to do?
We call it an opinion. Safe. Everyone has one. All we have to do is claim superior knowledge.
And it is much safer, and our opinion more believable if we make it understandable to the reader. One form of 8½” by 14” paper, or a sideways spreadsheet. Visible, easy to visually compare the comparables, and requires no further unfolding. Understandable.
The understandability took precedence over reliability. Over accuracy. Over precision.
What is lost is useful information. Information which can improve precision, accuracy, and relevance. We give up our real objective for subjective reality. Habit, inertia, old forms, the accountant’s spreadsheet rule over the profession. Why change?
